 Tiger's Jai-Alai Chalk Talk

Discussion forum for Jai-Alai Heaven
Foro de la discusión para el Cielo de Cesta Punta
Forum de discussion pour le Paradis de Pelote Basque
hits since 8/12/03
Chalk Talk Registration Participación en Chalk Talk
 OneStop Entries, Results, Statistics
Magic City Scratches
OneStop Entries, Results, Statistics
Magic City ScratchesHall of Fame "Question of the Week" Archive

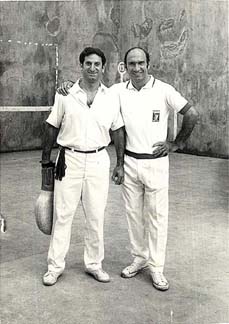
The pride of Mutriku: Egurbi & Churruca
(see post below)
Happy Birthday, pelotadawg (Tuesday)
Happy Birthday, MJAFANALWAYS (Wednesday)