 Tiger's Jai-Alai Chalk Talk
Discussion forum for Jai-Alai Heaven
Foro de la discusi�n para el Cielo de Cesta Punta
Forum de discussion pour le Paradis de Pelote Basque
Chalk Talk Registration��� Participaci�n en Chalk Talk
�OneStop Entries, Results, Statistics���
Magic City ScratchesHall of Fame����"Question of the Week" Archive
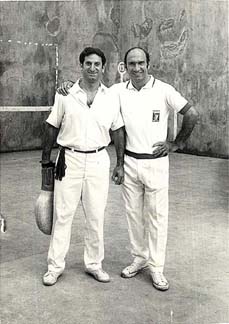
The pride of Mutriku: Egurbi & Churruca
(see post below)
Happy Birthday, pelotadawg (Tuesday)
Happy Birthday, MJAFANALWAYS (Wednesday)